
How One AWS Bill Went From Almost $8,000 a Month Toward $6,000
Two real scans, eight weeks apart, on the same account
GreenOps Scan is a free, read-only CLI that finds wasted AWS resources from your terminal. You run npx greenops-scan against a read-only AWS profile, and it returns a list of idle or oversized resources with dollar estimates — no write access, no cloud uploads, no signup.
Cloud bills rarely jump overnight. They drift. A launch adds an oversized Fargate service. A prototype gets a managed database. An experiment ends, but the resources it created stay running. Buckets accumulate without a lifecycle policy because no one owns the cleanup decision. By the time the monthly total becomes uncomfortable, the waste is already spread across a dozen services.
This post is not a hypothetical write-up. It is two real GreenOps Scan reports, run eight weeks apart, against the same production AWS account. We are showing exactly what the scanner found, what the team changed between the two scans, and what AWS's own Cost Explorer forecast says is likely to happen next.
The account and the company behind it
The account belongs to a mid-sized software company that runs a mix of customer-facing services and internal platforms on AWS. Its stack is probably familiar if you work in a growing tech org: containerized services on ECS/Fargate, a DocumentDB cluster, ElastiCache, RDS, an Application Load Balancer, AWS Transfer Family, and the standard security and compliance tooling (GuardDuty, CloudTrail, Config, KMS, Secrets Manager). Nothing exotic, nothing hyperscale — just a working AWS account where a small platform team is keeping a lot of services running.
Like many teams, they do not have a dedicated FinOps person. Costs drifted as projects shipped, prototypes ran, and experiments ended. By the time the monthly bill became uncomfortable, the waste was spread across a dozen services, and no single Cost Explorer view showed the whole picture clearly.
When we ran the first npx greenops-scan, the account was already billing $7,726.20 for the month, with the two largest line items being ECS ($3,235.93) and DocumentDB ($1,506.78).
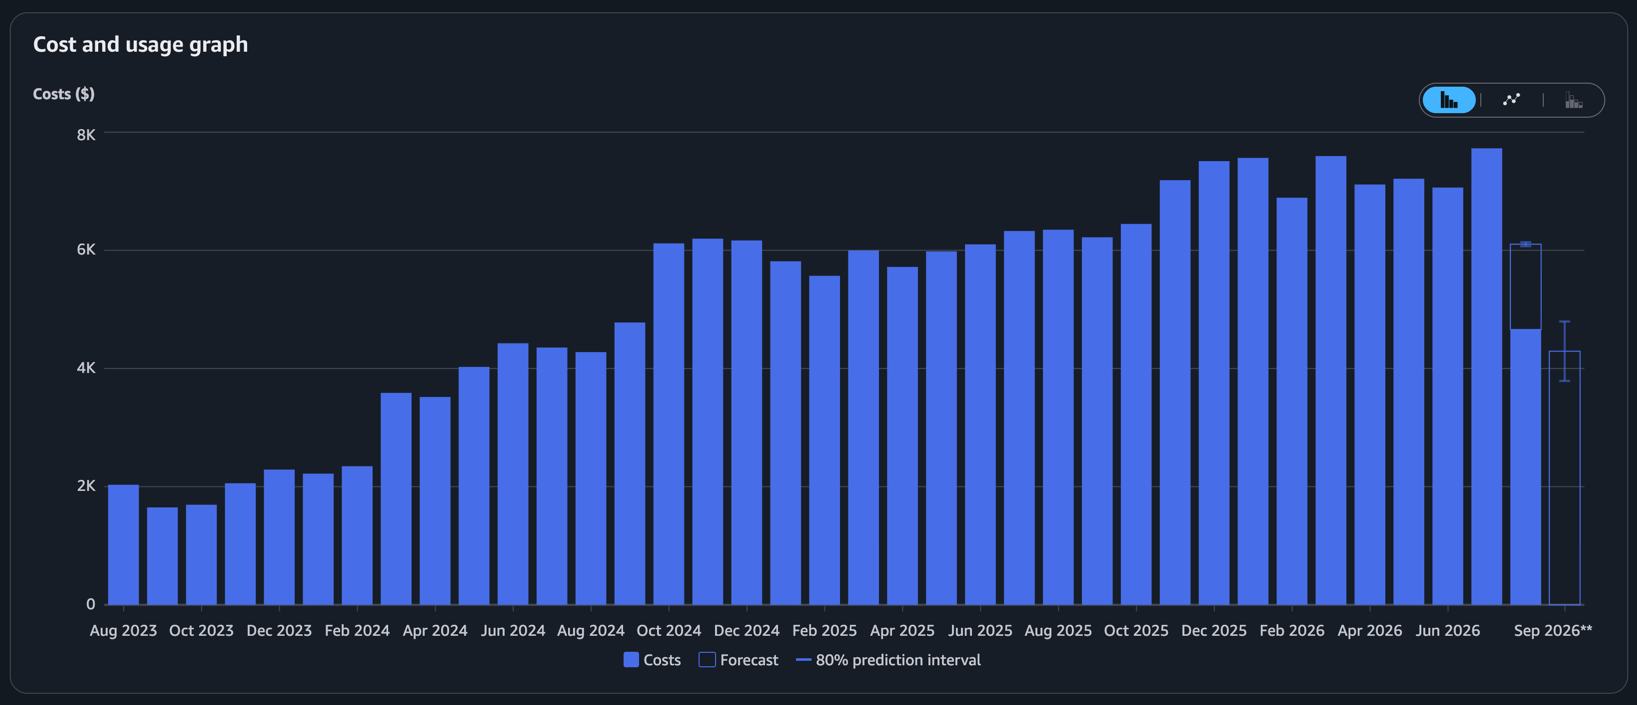
The account's real Cost Explorer history: a near-continuous climb from about $2,000/month in late 2023 to nearly $7,800/month by mid-2026. The last bar is AWS's own forecast (marked with ** and an 80% prediction interval) for the following month — not a confirmed result, but a trend AWS's own model expects given recent changes to the account.
What the first scan found
Running npx greenops-scan against a read-only profile for this account returned 53 findings worth an estimated $1,176.83 a month ($14,121.96/year) in identifiable waste. Nothing in the list was exotic — it was ordinary drift, spread across three modules.
ECS: 15 over-provisioned Fargate tasks — $756.83/month
The scanner flagged 15 Fargate task definitions running well above any resource profile the workload needed, ranging from 2 vCPU/4 GB up to a single task provisioned at 16 vCPU / 32 GB. It also flagged one ECS cluster with no running tasks or services at all.
| Task size | Findings | Est. savings/mo |
|---|---|---|
| 16 vCPU / 32 GB | 1 | $172.99 |
| 8 vCPU / 16 GB | 4 | $86.50 each |
| 4 vCPU / 8 GB | 2 | $43.25 each |
| 2 vCPU / 4 GB | 7 | $21.62 each |
| Empty cluster | 1 | $0 (still worth cleaning up) |
S3: 37 buckets with no lifecycle policy — $415/month
Thirty-seven S3 buckets — mostly CodeBuild/CodePipeline artifact buckets — had no lifecycle rules, meaning every object stayed in the Standard storage tier indefinitely instead of transitioning to Glacier or being expired. Individually cheap ($10–15/month per bucket), collectively the third-largest line item in the report.
EC2: 1 stopped instance still billing storage — $5/month
A stopped t2.small instance was still incurring EBS storage costs. Small on its own, but the kind of thing that's invisible in Cost Explorer's per-service view and only shows up when something checks per-resource state.
What changed by the second scan
Eight weeks later, the same account, scanned again: 1 finding, worth $105.12 a month.
The one remaining item was a DocumentDB cluster (kaeinstancedb) still running on an Intel-based db.r5.xlarge instance class, where switching to a Graviton-based class would cut roughly 30% off that instance's cost.
That means between the two scans, 91% of the originally flagged waste was addressed — the 15 over-provisioned Fargate tasks, the 37 S3 buckets missing lifecycle rules, and the idle EC2 instance were no longer showing up as findings, while a new opportunity (the DocumentDB instance family) surfaced on the second pass.
Update: that last finding has since been resolved too. The kaeinstancedb cluster was migrated to db.r6g.large — Graviton, as the scan recommended, but one size class smaller than the db.r7g.xlarge the report suggested. That's a bigger cut than the flagged $105.12/month, since it downsizes the instance itself in addition to switching CPU architecture. With that change, every finding from the first scan has now been addressed.
Reading the Cost Explorer graph honestly
The graph above is the account's real multi-year cost history, not an illustration. Two things are true about it, and it's worth being precise about which is which:
- Confirmed: the bill climbed steadily from roughly $2,000/month in late 2023 to nearly $7,800/month by mid-2026, and the scan-over-scan comparison above confirms that a meaningful chunk of flagged waste was cleaned up in that window.
- Not yet confirmed: the final bar on the graph is AWS Cost Explorer's own forecast for the following month, explicitly marked with a double asterisk and an 80% prediction interval, projecting the bill down toward roughly $5,000–$6,000. That's AWS's own model reacting to the account's recent trend — a forecast, not a closed month.
We're reporting both numbers because a scanner report is only useful if it's honest about what it can and can't prove. The $1,176.83 → $105.12 change in flagged waste is a fact from two independent scans. The next month's total landing near $6,000 is AWS's own projection, and worth watching, not asserting as done.
What made the difference
Three things, consistently:
- A clear list. The scanner turned an abstract "the bill keeps climbing" concern into 53 specific resources with issue descriptions and dollar estimates.
- A safe first step. Because the scan is read-only and runs locally, nothing needed elevated write access to produce the list — the actual changes (right-sizing Fargate tasks, adding lifecycle rules, terminating an idle instance) were made deliberately, by hand.
- A second (and third) scan to check the work. Re-running the same read-only scan two months later is what actually confirmed 91% of the flagged items were resolved, instead of assuming the fixes stuck — and the follow-up on the last item confirmed the rest.
A realistic takeaway
Not every account will show a full cleanup between two scans, and not every Cost Explorer forecast will play out exactly as projected. But the pattern here — over-provisioned compute, storage without lifecycle rules, and a stale instance family — is common enough that it's worth checking for on any account whose bill has been drifting upward for a while.
npx greenops-scan
The CLI is free to use. The output is local. Run it twice, a few weeks apart, and see what actually changed.